
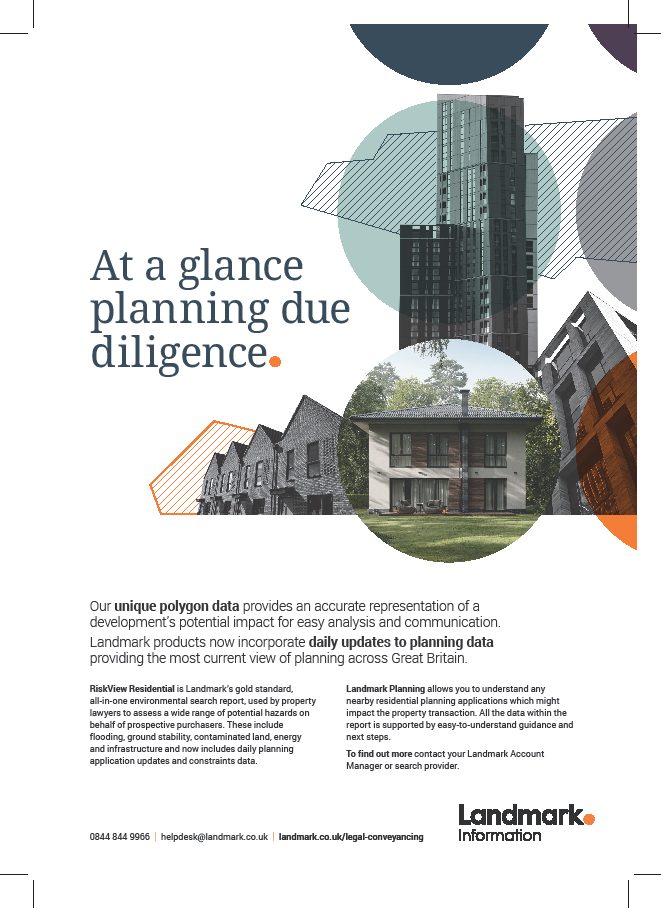
Data Insights Report: Planning Applications
The last few tumultuous years for the UK housing market have highlighted one stark truth: housing supply is not meeting demand. Indeed, housing is one of the core pillars of the government’s levelling up agenda, underscoring the need to radically rethink the way new housing is planned and developed. Central to meeting this need will be the planning process itself.
It is the view of many that the current UK planning process is flawed, often cumbersome and a source of frustration for stakeholders across the entire spectrum, from developers to communities. Digitisation will undoubtedly play its part in transforming this process; the wealth of technologies now available (such as interactive geospatial technology, virtual simulations, and, of course, data) to inform and shape planning offer real opportunities for change. With this in mind, the halfway point of 2022 felt like a good time to step back and take a look at the data on planning applications over the past ten years.
In our newly released Data Insights Report: Planning Applications, we revisited the wealth of environmental, land and property data that we gather, manage and supply to the property industry on a daily basis, and analysed relevant datasets to provide a summary of planning trends between 2012 and 2021. Overall, we saw that, year on year, the rate of planning applications in the UK is increasing. In fact, in every region - except for London - the number of planning applications submitted per 100,000 people was at its highest in 2021, since 2012.
As well as pinpointing the regions with the highest and lowest application volumes, the report draws on data that reveals:
- Planning application types
- Granted/refusal rates
- Approval rates for renewable energy projects
- Approval rates in flood zones
- Essential amenities per approved planning application
The report also features expert commentary from Landmark’s Chris Loaring, Managing Director (Landmark Legal), who shares his observations on planning trends beyond ‘the Covid effect’ and highlights the growing implications of the journey to net zero in future planning policy.
“We know that the built environment has a huge role to play in the wider net zero ambition and that new-build development is a major factor within that. Equally, we will watch with interest to see how the data evolves in regard to planning applications relating to existing housing stock and the retrofit options and upgrades many homeowners are now choosing to undertake.
In the near future, I would hope to see a continuation - or even acceleration - of environmental considerations in new build planning policies. Concepts such as renewable energy installations on housing developments of a certain size, for example, would be great to see. Meanwhile, new build developments could well pave the way for widespread progress in new policies for establishing electric car charging ports. This might seem, on the face of it, a small point but collectively, ease of access to electric charging points as a given would make a huge difference in easing the transition from fossil fuel based to electric transport options.”
Piers Edgell, Landmark’s Client Director (Landmark Geodata) closes with a powerful argument for how planning data and the levelling up agenda are inextricably linked:
“We have seen much debate and anticipation around the original Planning Bill, and now the Levelling Up and Regeneration Bill which supersedes it. In terms of the new proposed bill, it will be interesting to see how its content evolves during its passage through parliament, and precisely which elements are ultimately given final Royal Assent.
What is notable to me, when we consider the planning data in this report through the levelling up lens, is that planning is about so much more than simply where developments will or will not be built. Every planning decision impacts the immediate environment, and so planning data could and should become a critical tool for informing and shaping social policies that aim to improve – or level up – communities. What, for example, could the kinds of planning data shown in this report tell us, when mapped against data on increasing property values or household incomes? What could the data we have summarised on amenities within the vicinity of planning applications tell us about location-specific standards of living and local needs? From a big picture point of view, we might even wonder how this kind of data might correlate with health and wellbeing indices, mortality, employment and income figures. My hunch is that it would underscore that planning has the potential to alter communities and change life-chances, more broadly than its immediate impact on the built environment.”
You can access this insightful, timely and data-rich report here.